The Workshop Dashboard
The Workshop Dashboard is the central view for managing day-to-day workshop activity. It organises the most important information for supervisors and technicians into four key questions:
- What's new that needs my attention? — handled by the Triage panel
- What are we working on right now? — handled by the Current Activity panel
- What have we missed that needs following up? — handled by the Outstanding Items panel
- What am I working on? — accessed via the Assigned To Me view within Current Activity
The dashboard is the default homepage for users with a Supervisor, Technician, or Maintenance Admin app role. Administrators can access it via the Works Management dropdown on their homepage, then selecting Workshop Dash. Asset Managers can access it by selecting Workshops on their homepage, then selecting Workshop Dash on the Workshops page. The layout and panels visible on the dashboard are controlled by dashboard configurations. See Workshop Dashboard Configuration.
Dashboard Layout
The dashboard is organised into collapsible panels. Which panels are visible and whether they are expanded by default depends on the configuration applied to your account. See Dashboard Configuration.
At the top of the page is a navigation menu (the burger icon) with shortcuts to other areas of the application. Next to it, a box labelled Workshops shows which workshops' data is currently loaded. This is for display only. To change which workshops are shown, use the Workshops selector in the Dash Configuration panel.

Navigation menu
Select the burger icon to open the navigation menu. The available items are:
| Menu item | Where it goes |
|---|---|
| Reload | Reloads all dashboard data |
| Monitoring and Scheduling | Works Scheduler |
| Request List | The Request and Work Order template list |
| Materials | Materials |
| Time Recorder (submenu) | learn more in Time Recording |
| Time Recorder Documents | Time Recorder Document Listing |
| Time Recorder Report | Time Recorder Report |
| Accounts | Accounts |
| Asset List (submenu) | learn more in Asset List |
| Standard List | The standard asset list |
| Custom List | The custom asset list |
| Document Library | Asset Document Library |
| Daily Driver Report | Daily Driver reporting |
| Asset Services Due Report | Asset Services Due report |
| Safety Tag List | Safety Tags |
| Service Configuration | Service Schedules |
| Asset Booking | Booking an Asset |
| Bulk Refuel | Recording Bulk Fuel Transactions |
| Jobs | Jobs |
| Workshops and Stores | Workshops and workshop dash configurations |
| Help Documentation | The Formbird FLEET help centre |
Panels
The panels below the navigation menu are:
| Panel | Purpose |
|---|---|
| New Requests and Work Orders | Quick-create buttons for starting a new request or work order |
| Triage | Incoming requests and unassigned work orders that need a decision before work can begin |
| Current Activity | Active requests and work orders already in the pipeline |
| Time Recorders | Recent time entries logged against work orders. Learn more in Time Recording |
| Special Monitoring | Assets or items flagged for close attention. Learn more in Questionnaires and Defect Monitoring |
| Outstanding Items | Work that may have slipped through or needs following up |
| Conversation List | Open conversations related to the workshop. Learn more in Conversations |
| Report Listing | Links to workshop reports |
| Dash Configuration | Settings for customising your dashboard layout |
New Requests and Work Orders
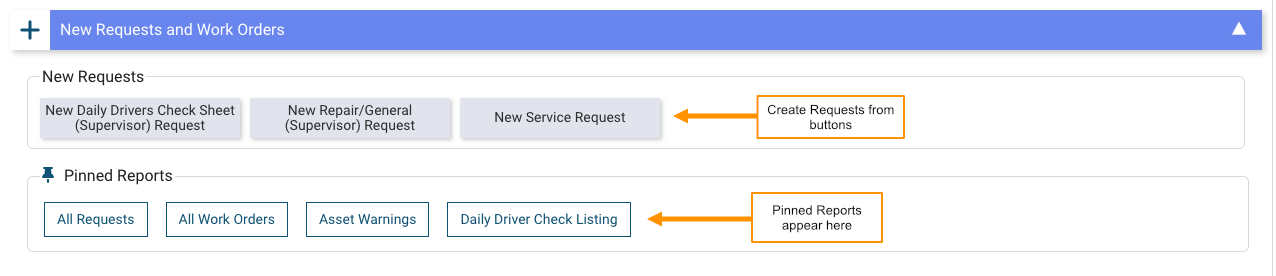
The New Requests and Work Orders panel provides quick-create buttons for starting new records directly from the dashboard, without needing to navigate away.
The panel is divided into two sections displayed side by side:
- New Requests — buttons that open a new blank request form, each in a new browser tab
- New Work Orders — buttons that open a new blank work order form, each in a new browser tab
Each button corresponds to a specific template type configured by an administrator. Buttons within each section are listed alphabetically. If no buttons have been configured for a section, that section is hidden.
Any reports you have pinned as favourites also appear in this panel, below the create buttons. See Pinned Reports for details.
Which buttons appear is controlled by the Show Create Buttons For setting in the active dashboard configuration. See Workshop Dashboard Configuration.
Triage
The Triage panel shows incoming work that has not yet been actioned: requests and work orders that still need a decision about when they will be done, who will do them, or whether a work order needs to be created.
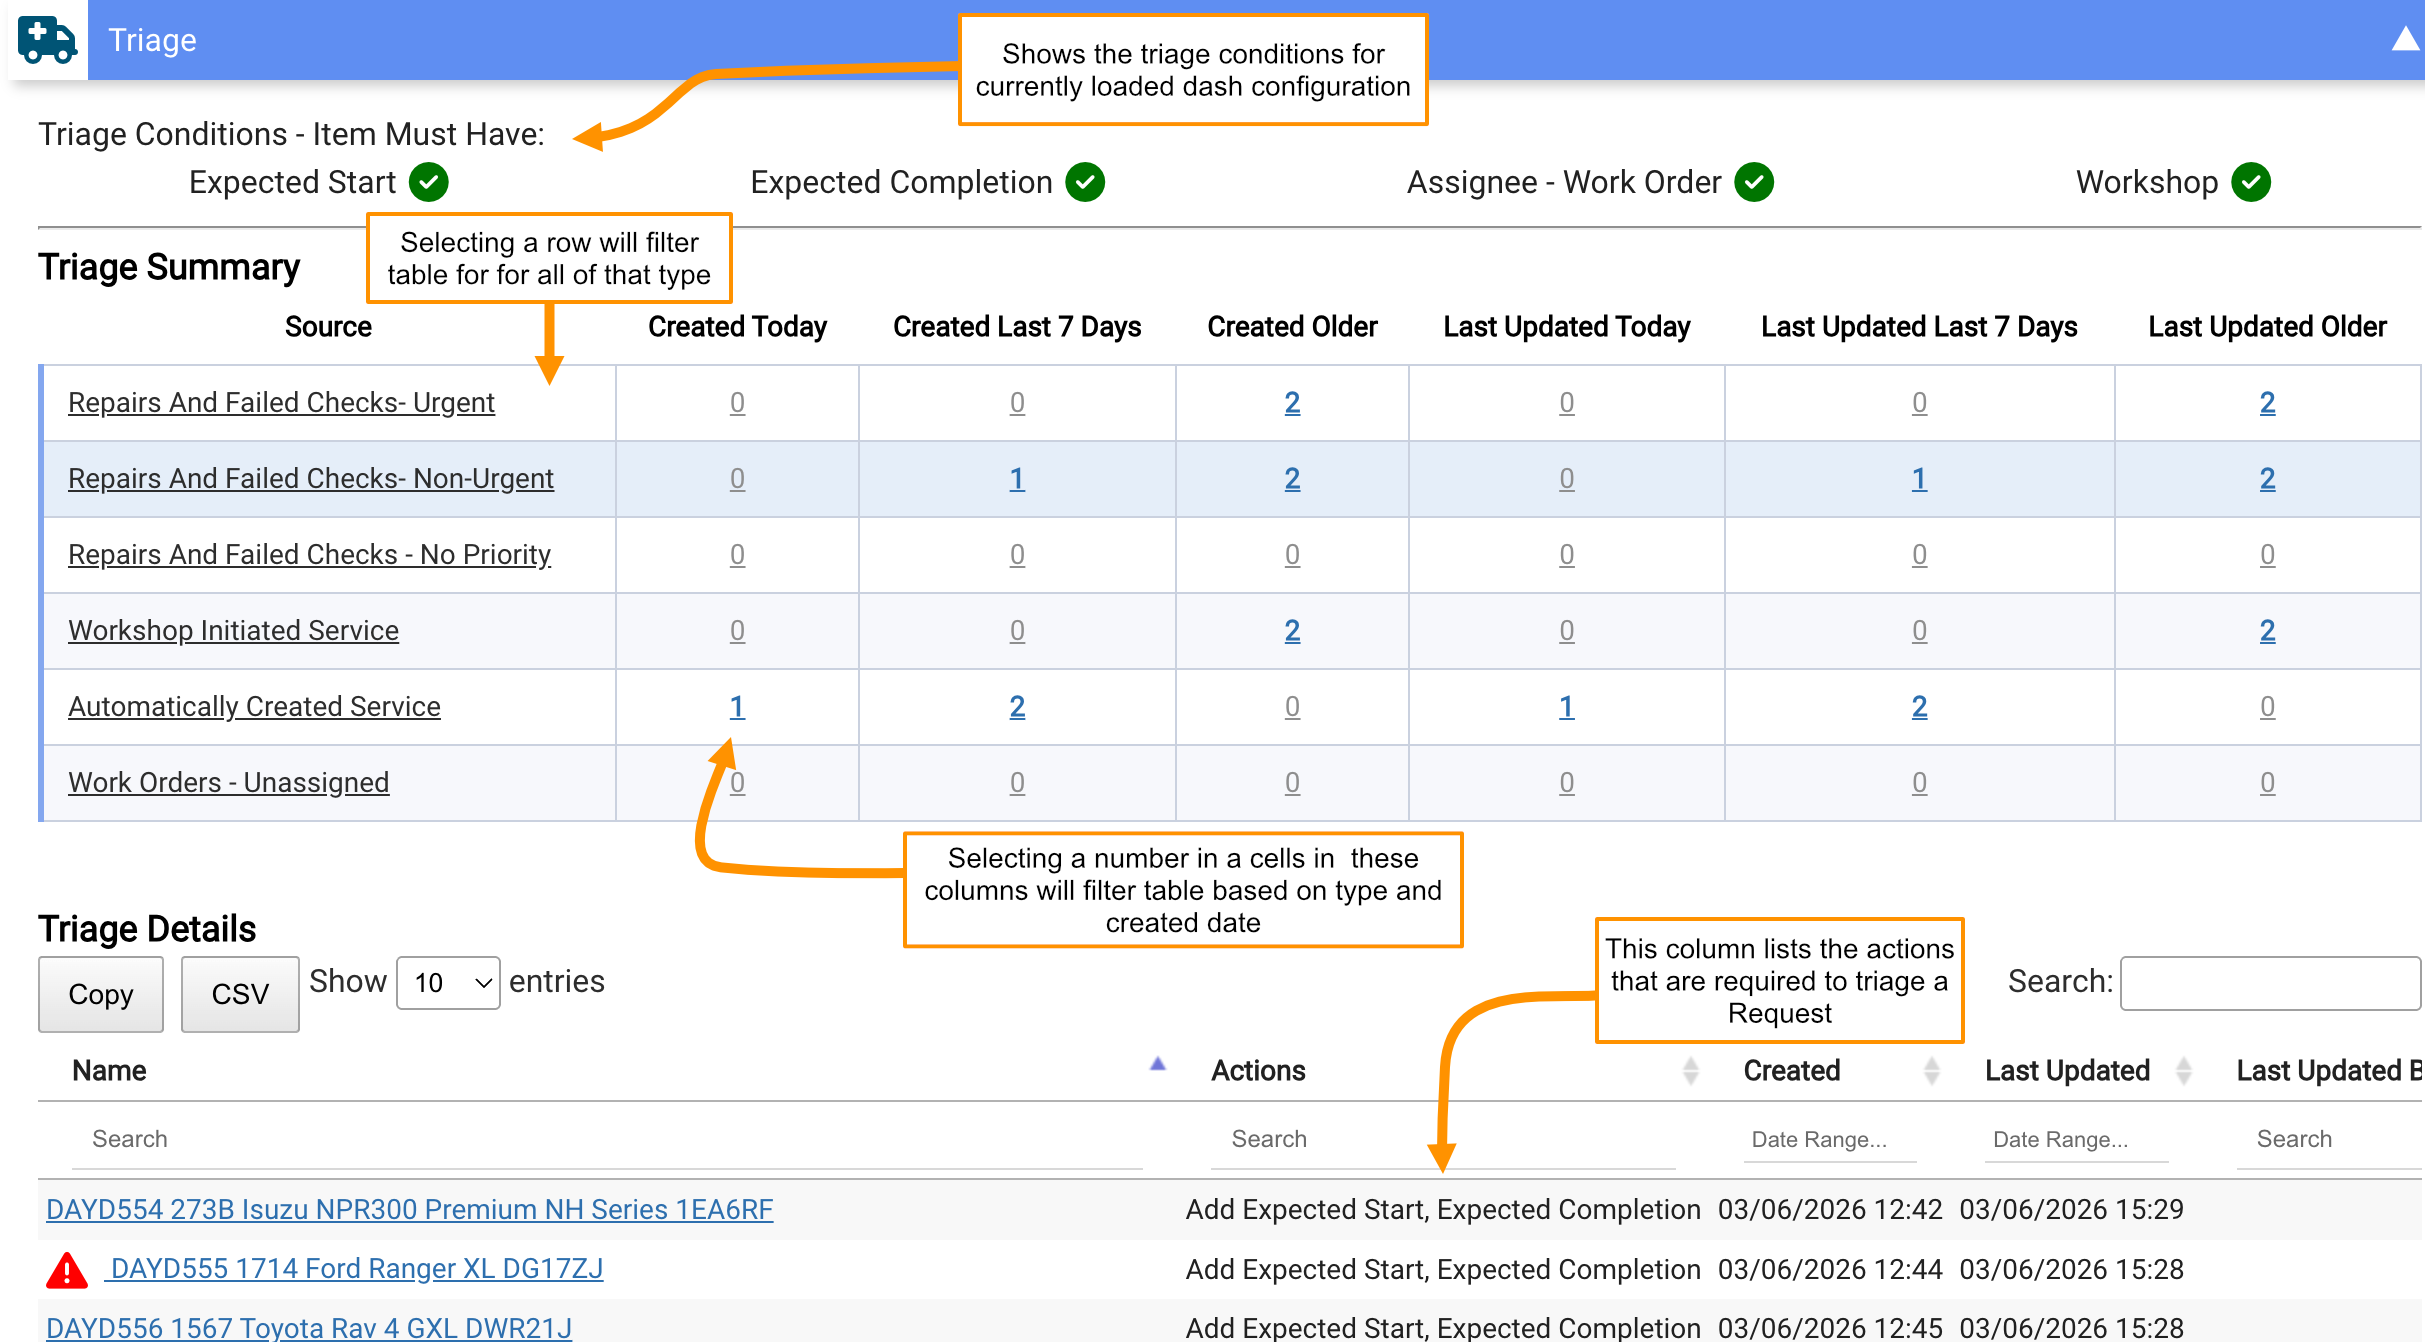
Above the summary table, the active triage conditions for your configuration are listed. These are the criteria an item must meet before it is removed from Triage. See What counts as "actioned"? below for a description of each condition.
A summary table groups untriaged items by type, with counts across time periods (created today, created in the last 7 days, created older, and the same again by last updated date). Select any row or cell in the summary table to filter the details table below it to that category and time period. Select Clear Summary Filter to return to showing all triage items.
The categories are:
- Repairs And Failed Checks- Urgent — repair requests and Daily Drivers Check Sheet faults with a priority of "Urgent – Fleet Out of Service"
- Repairs And Failed Checks- Non-Urgent — repair requests and Daily Drivers Check Sheet faults with a priority of "Non-Urgent – Fleet Operational"
- Repairs And Failed Checks - No Priority — repair requests and Daily Drivers Check Sheet faults with no priority set
- Automatically Created Service — service requests generated by the system (for example, based on odometer readings or time intervals)
- Workshop Initiated Service — service requests created manually
- Work Orders – Unassigned — work orders that have no assignee
Triage Details table
Below the summary, the details table lists every individual untriaged item matching the current filter. Columns include:
- Name — linked to the request or work order document
- Actions — what is missing before the item is considered actioned (for example, "Add Expected Start, Assignee")
- Created, Last Updated, and Last Updated By dates
- Expected Start and Expected Completion
- Assignee and Workshop
- Status, Request Reason, Request Type, and Reported By
The Workshop column is hidden when only one workshop is loaded.
What counts as "actioned"?
An item is removed from Triage once it meets all the triage conditions set in the active configuration. The available conditions are:
- Expected Start — the request has an Expected Start date
- Expected Completion — the request has an Expected Completion date
- Assignee – Work Order — a mechanic is assigned to at least one of the work orders under the request
- Assignee – Request — the request itself has an assignee
- Workshop — the request has a workshop assigned
- Non - Pending Status — the request has a status other than Pending
Administrators configure which conditions must be met. See Workshop Dashboard Configuration.
Current Activity
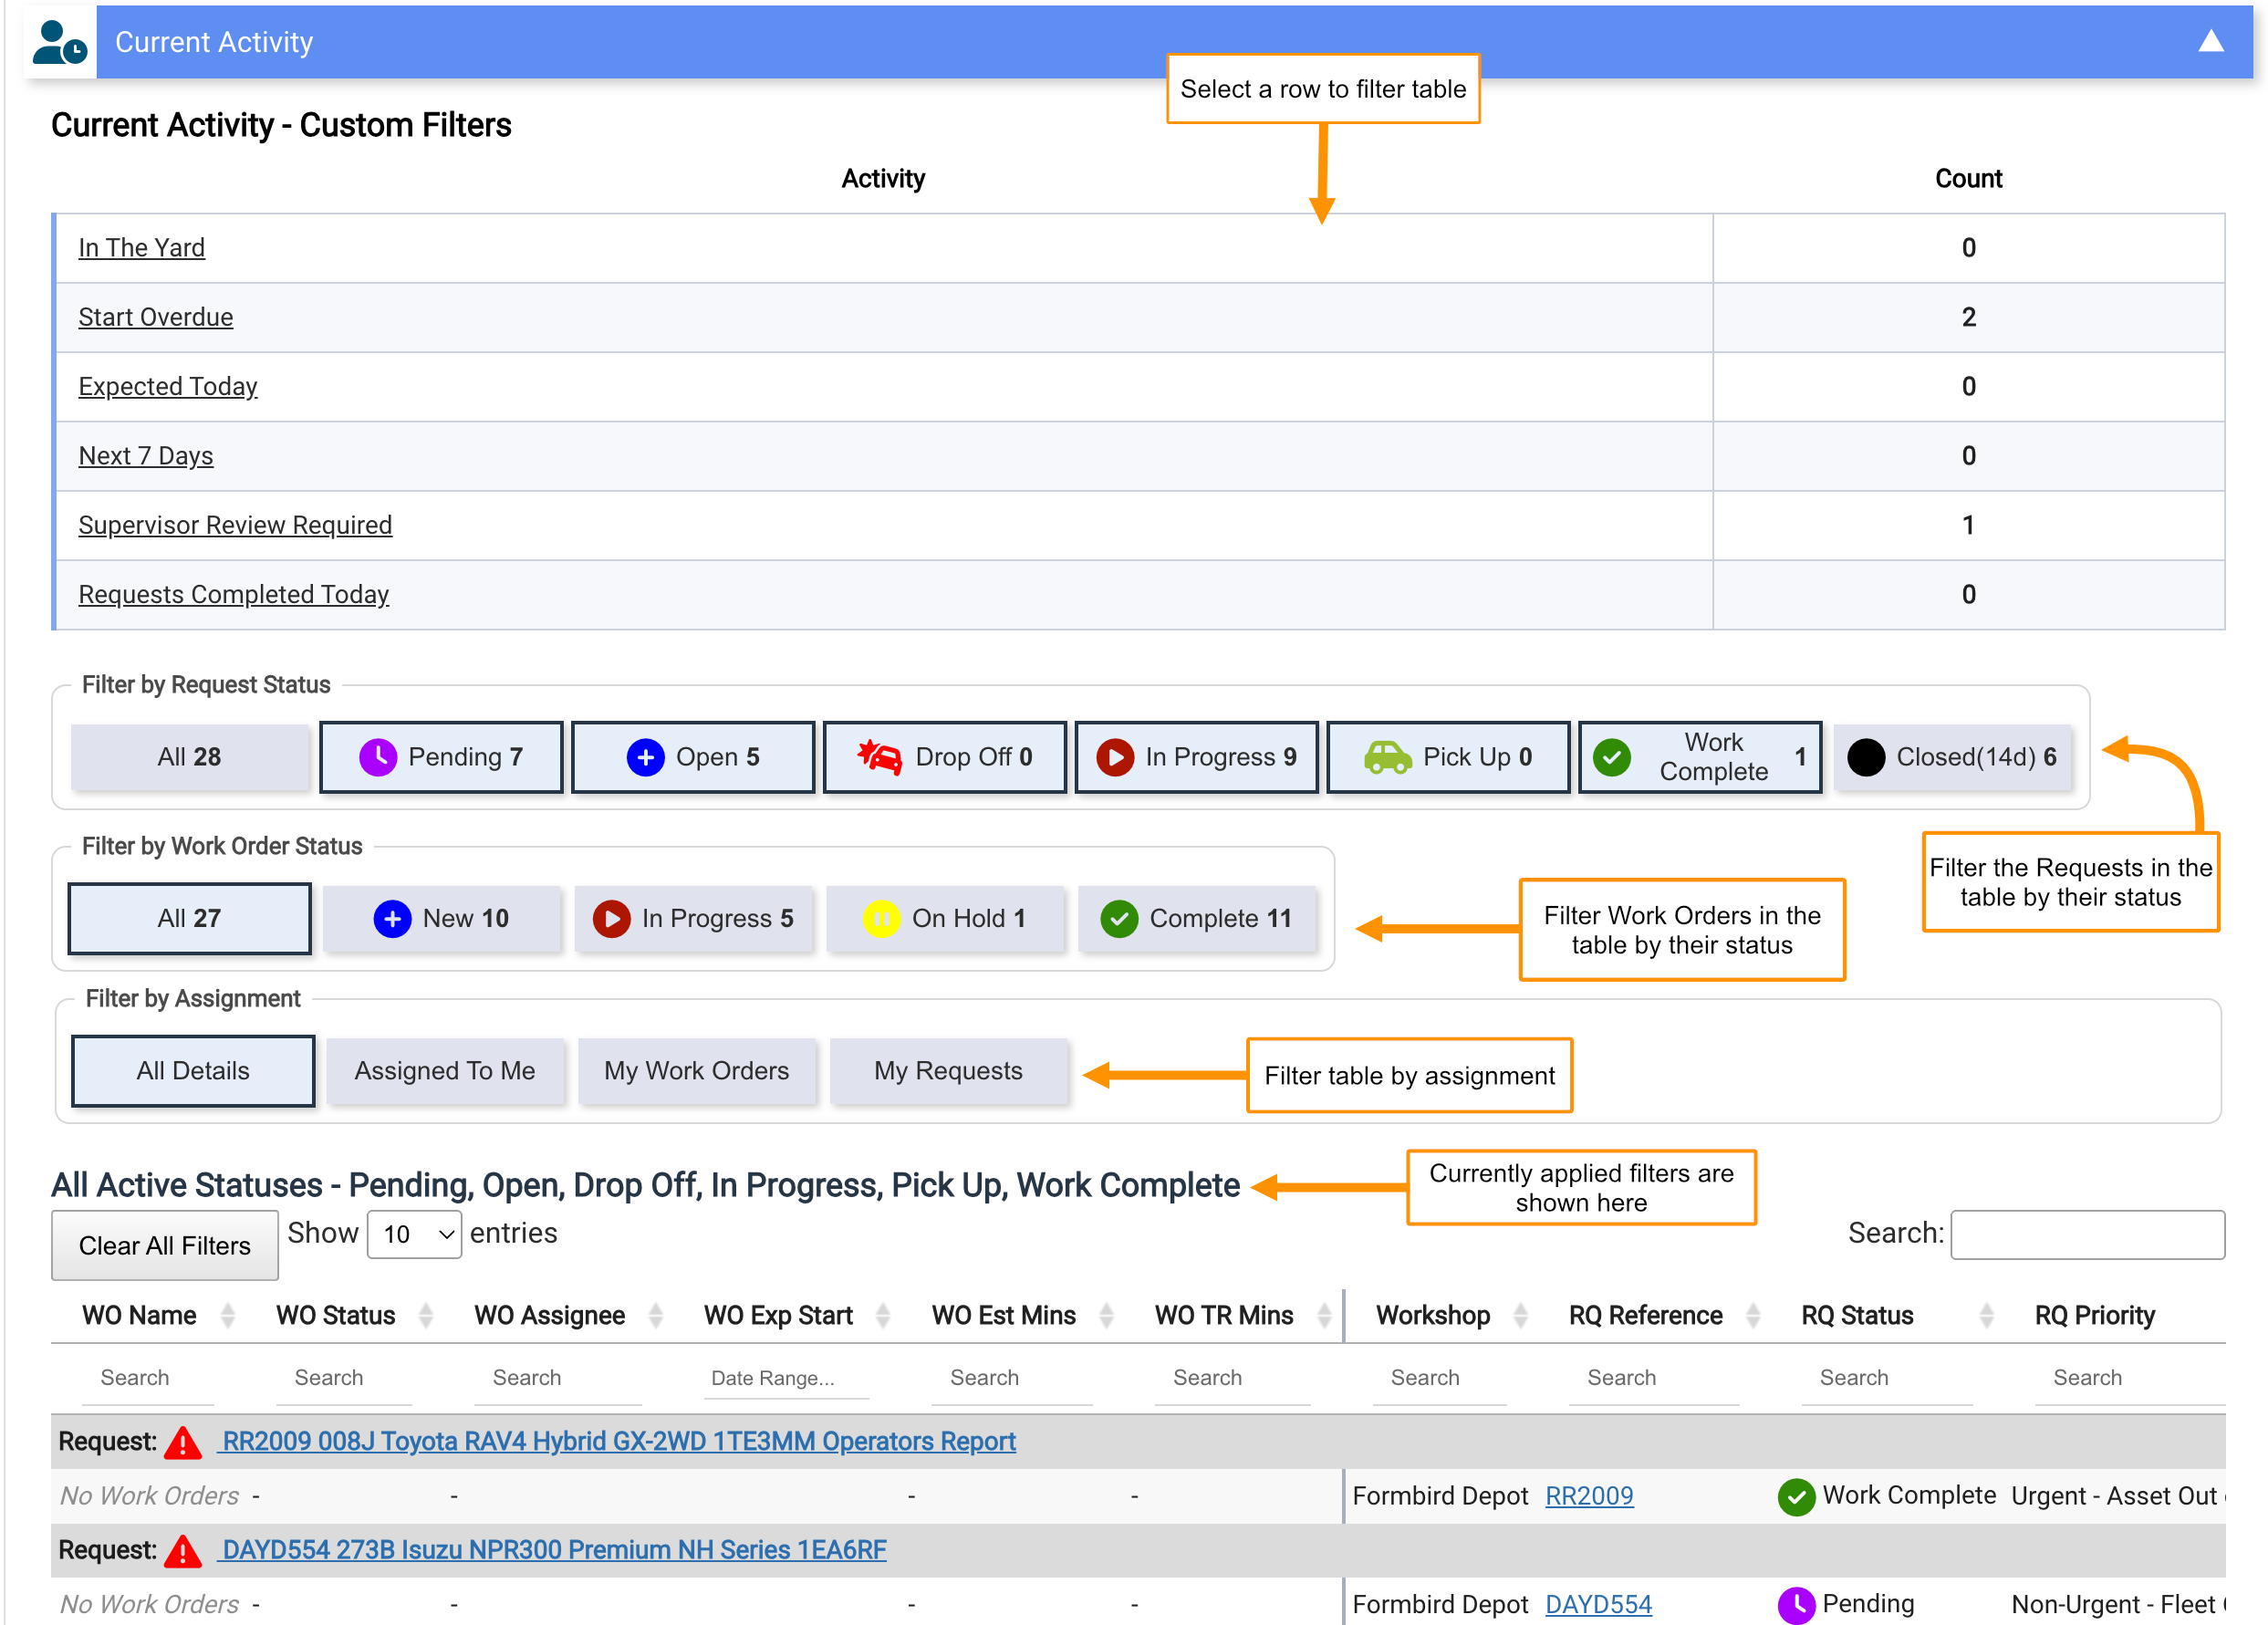
The Current Activity panel shows the full pipeline of active requests and work orders, what the workshop is managing right now.
Category filter buttons
Select a button at the top of the panel to filter the table to that group:
- In The Yard — requests with a status of Drop Off or Pick Up; assets physically at the workshop
- Start Overdue — requests still Open or Pending whose Expected Start date has passed
- Expected Today — requests with an Expected Start date falling today (excludes Closed, Cancelled, and Work Complete)
- Next 7 Days — requests with an Expected Start date within the next seven days
- Supervisor Review Required — work orders flagged for supervisor sign-off that are not yet complete
- Requests Completed Today — requests with a status of Pick Up, Closed, or Work Complete and a completed date of today
Request status filters
Filter the table to a specific request status: Pending, Open, Drop Off, In Progress, Pick Up, Work Complete, Closed
Work order status filters
Filter the table to a specific work order status: New, In Progress, On Hold, Complete
Activity table
Each request appears as a grouped header row showing the asset photo, the request name, and the request description (if one has been entered). Work orders belonging to the request are listed below that header row.
The table includes a WO Instruction column and an RQ Date Initiated column. The table can be sorted by Date Initiated.
View filters
Use the view buttons to narrow the table to work relevant to you:
- All Details — shows all activity across the selected workshops
- Work Orders — shows all work orders across the selected workshops, regardless of assignee
- Requests — shows all requests across the selected workshops, regardless of assignee
- Assigned To Me — shows requests and work orders where you are the assignee
- My Work Orders — shows only work orders assigned to you
- My Requests — shows only requests assigned to you
Time Recorders
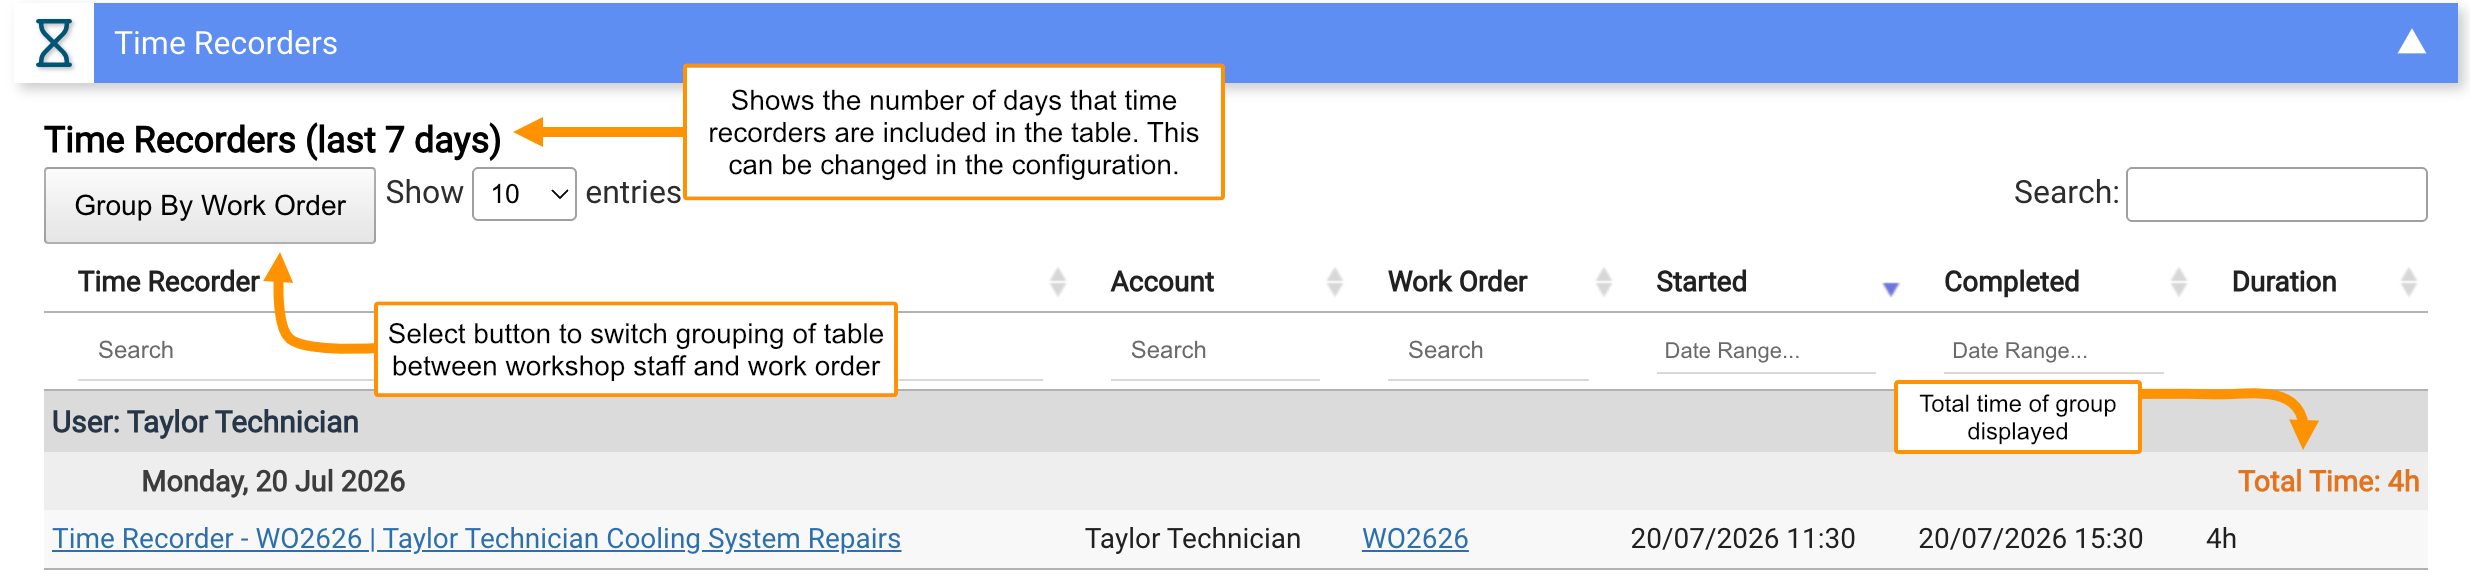
The Time Recorders panel shows recent time entries logged against work orders for the selected workshops.
Use the toggle at the top of the panel to switch between grouping time recorders by User or by Work Order.
Date range: By default, the panel shows entries for the number of days set in the dashboard configuration. To view a different period, select the date input and choose a start and end date. The range is capped at 31 days.
Name filter: Scrolling buttons show the names of staff who have time entries in the current range. Select a name to filter the table to that person's entries. Select multiple names to show a subset. The filter resets to showing everyone when the date range changes.
Learn more in Time Recording.
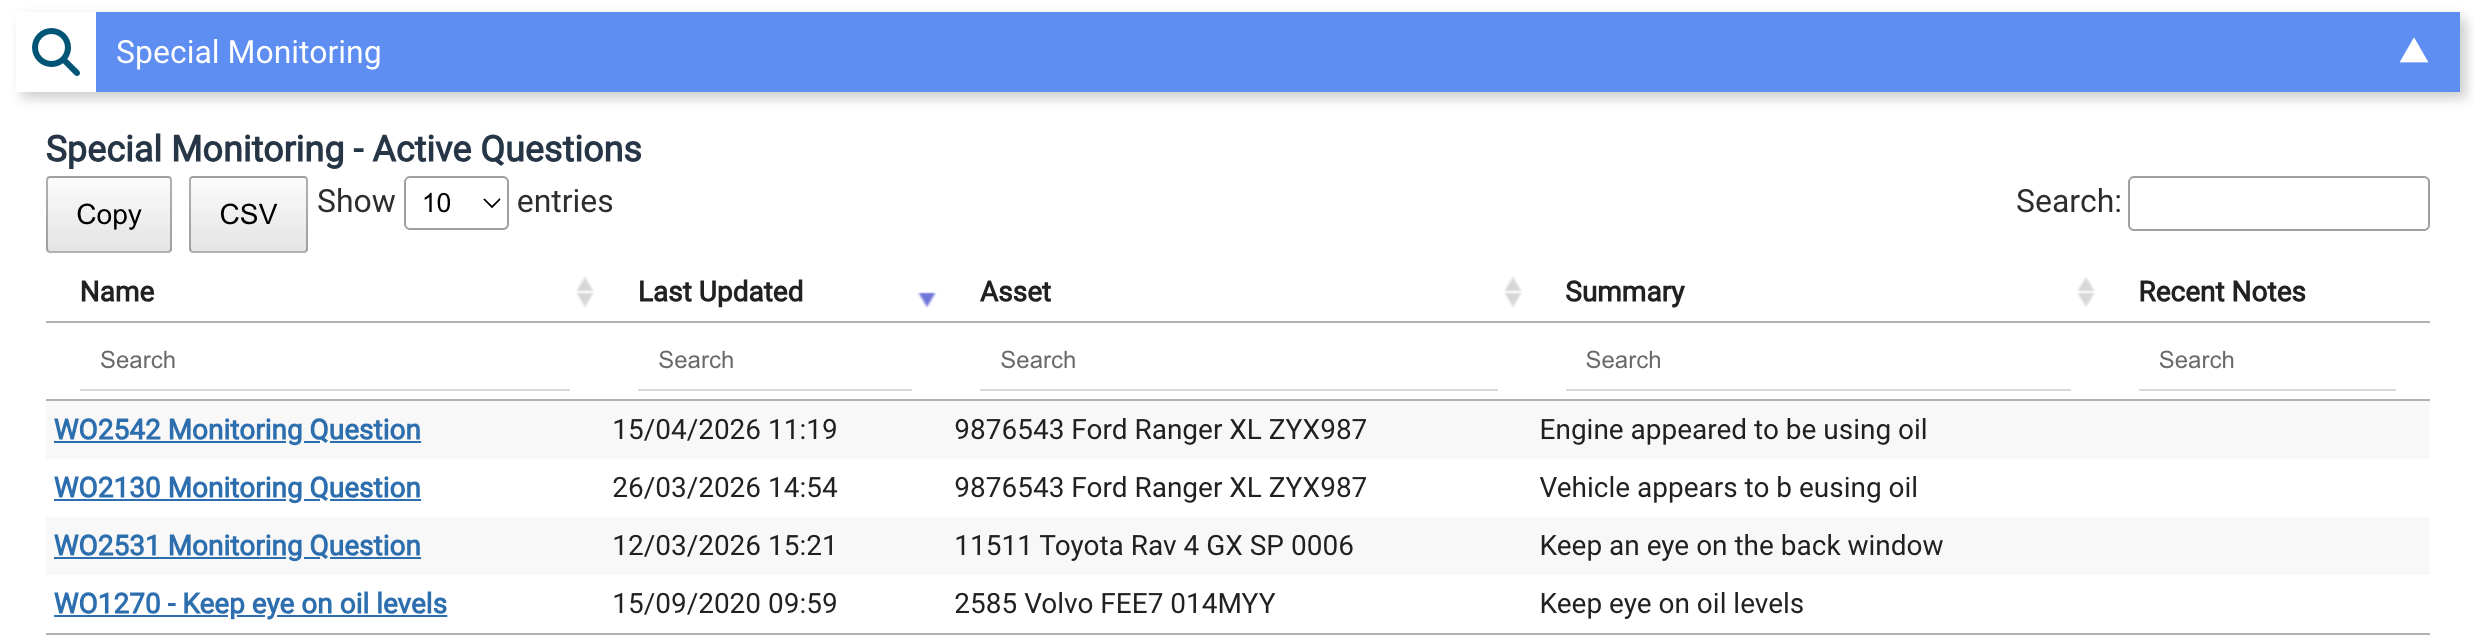
Special Monitoring
The Special Monitoring panel shows assets or items that have been flagged for close attention. Learn more in Questionnaires and Defect Monitoring.
Outstanding Items
The Outstanding Items panel groups work that may need following up: requests not formally closed, work orders on hold or overdue, and time recording gaps.
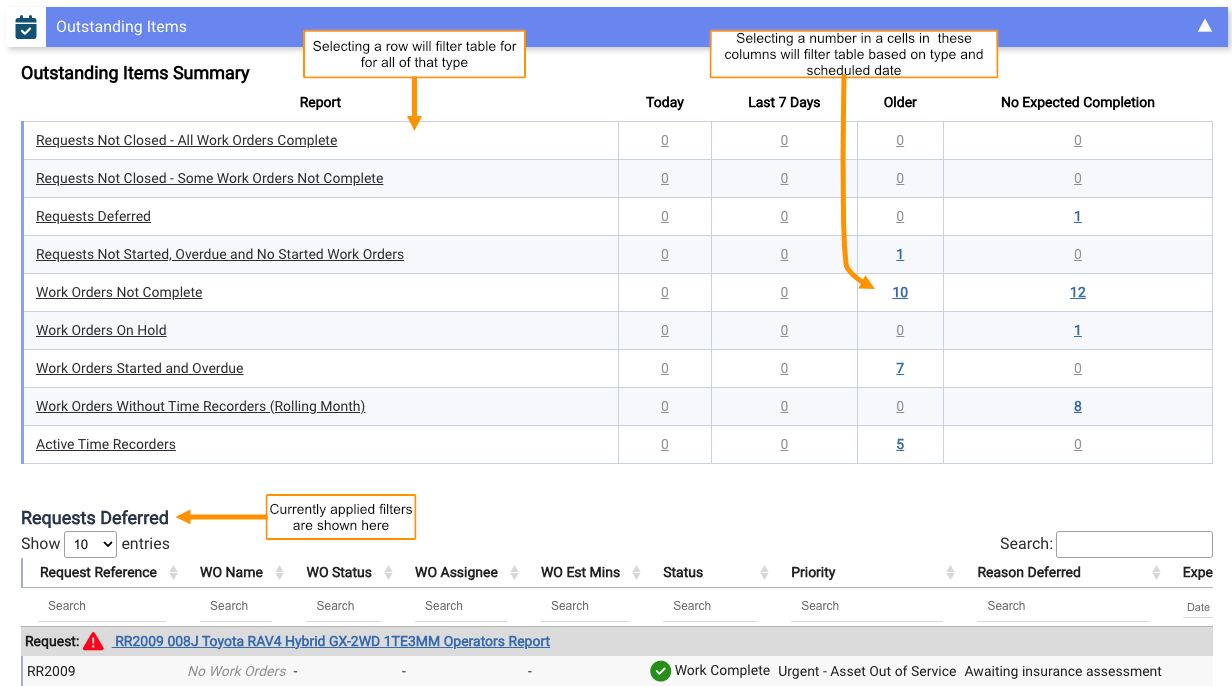
Items are broken down by their Expected Completion date: Today (items overdue today), Last 7 Days (a rolling 7-day window, not the current calendar week), Older (anything before the last 7 days), and No Expected Completion (items with no date set).
Select any row or cell to filter to those items. Results are sorted by assignee and least recently updated first.
The categories are:
- Requests Not Closed – All Work Orders Complete — the mechanics have finished every work order under the request, but the request itself hasn't been closed
- Requests Not Closed – Some Work Orders Not Complete — the request is at Work Complete or Pick Up status, but at least one work order under it is not yet complete
- Requests Deferred — deferred requests that are not closed or cancelled
- Requests Not Started, Overdue and No Started Work Orders — requests that are Open or Pending with an Expected Start in the past, and none of their work orders have been started
- Work Orders Not Complete — work orders with a status of New, In Progress, or On Hold
- Work Orders On Hold — work orders explicitly placed On Hold
- Work Orders Started and Overdue — work orders with a status of New and an Expected Completion date in the past
- Work Orders Without Time Recorders (Rolling Month) — work orders created more than a month ago with no completed time logged and no active time recorder running
- Active Time Recorders — time recorders that have been started but not yet stopped
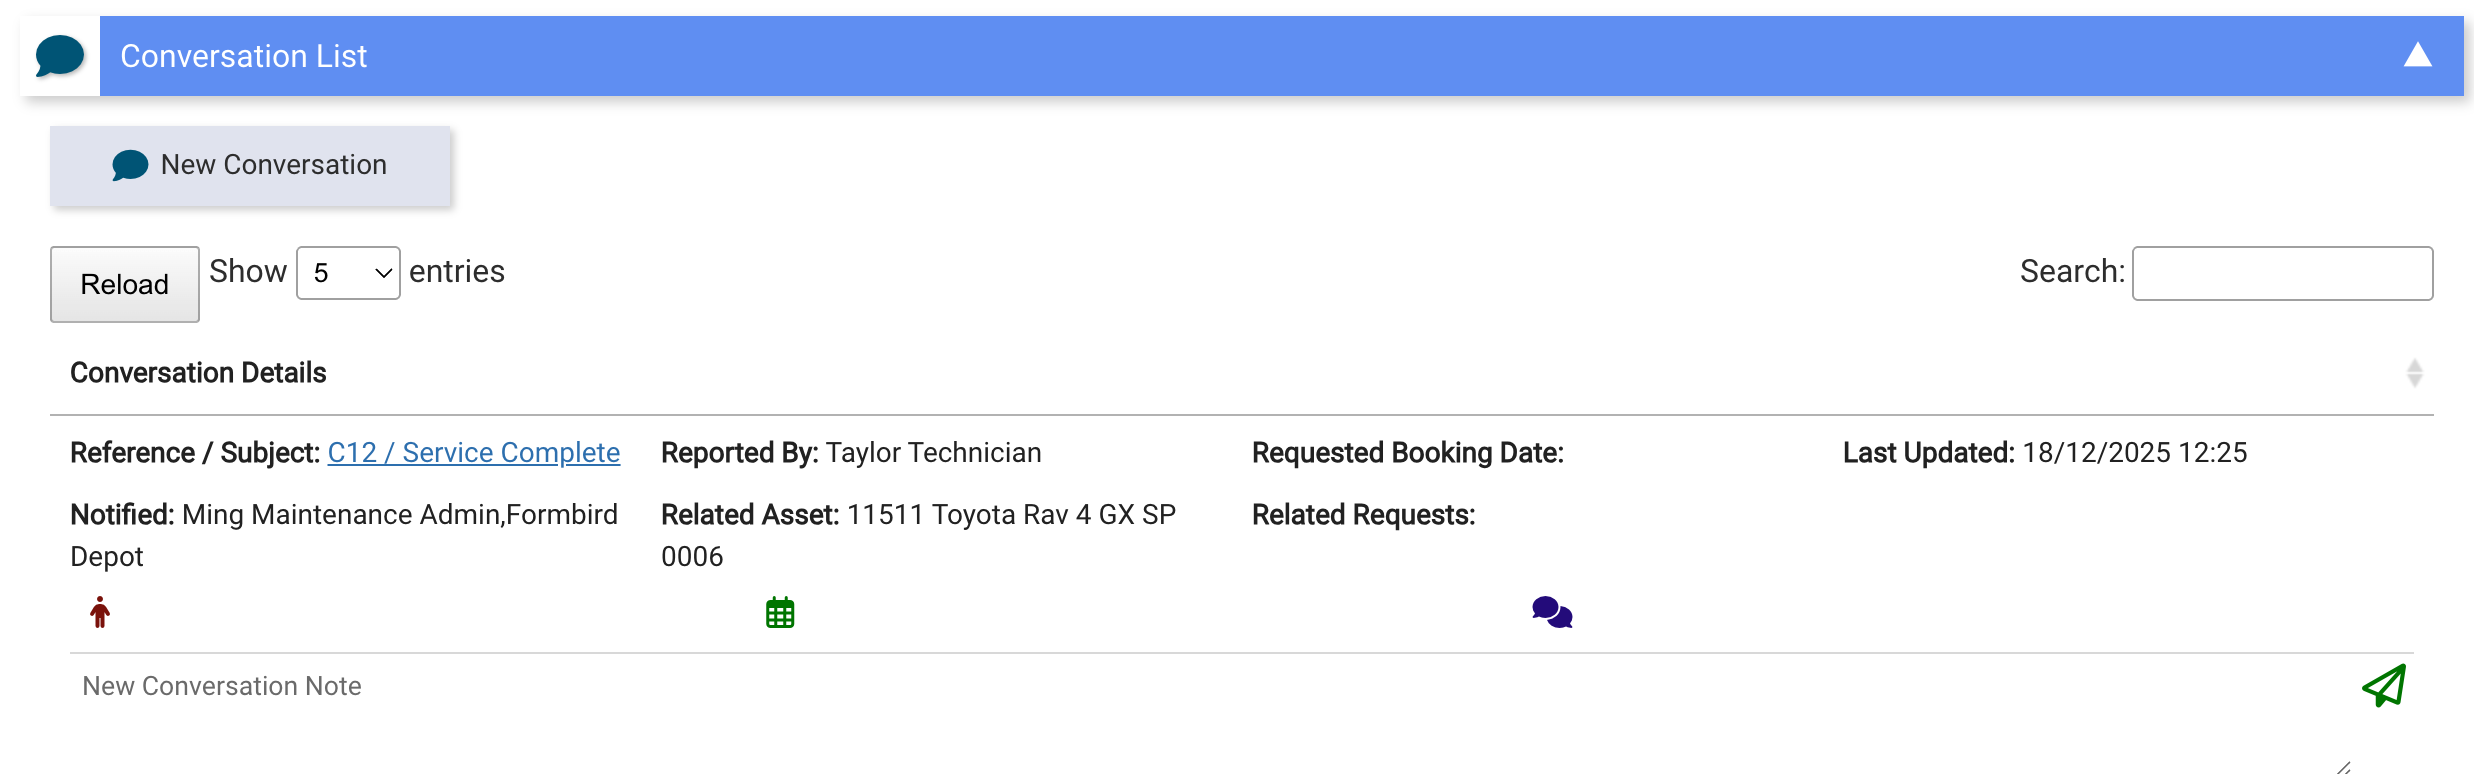
Conversation List
The Conversation List panel shows open conversations related to the workshop. Learn more in Conversations.
Report Listing
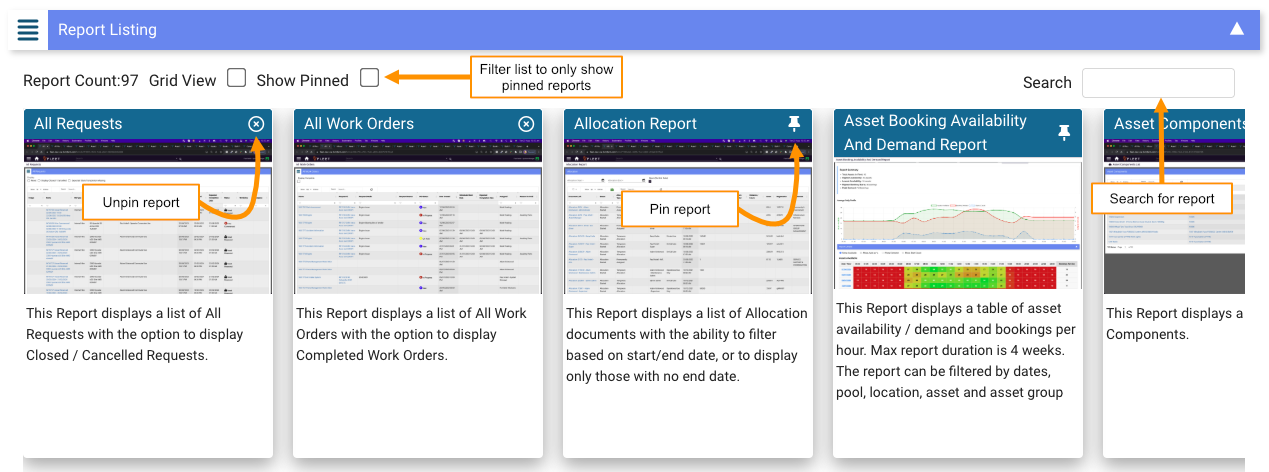
The Report Listing panel provides quick links to workshop reports. Learn more in Workshop Reports.
Pinned Reports
You can pin frequently used reports as favourites so they are easy to find. Pinned reports are displayed at the top of the page, within the New Requests and Work Orders panel.
The New Requests and Work Orders panel must be set to display in your dashboard configuration for pinned reports to be visible. If you do not see your pinned reports, check that this panel is enabled. See Workshop Dashboard Configuration.
To pin a report, select the pin icon next to the report name in the Report Listing panel. To unpin a report, select the X icon that appears on the pinned report at the top of the page.
Use the Show Pinned checkbox in the Report Listing panel to filter the list to only your pinned reports.
Pins are saved per user. Reports pinned on the Workshop Dashboard are separate from those pinned on other menus.
Dash Configuration
The Dash Configuration panel lets you customise your dashboard layout. Select it at the bottom of the page to:
- Select a configuration from the Load Configuration dropdown to switch to a different layout. This shows any Role Specific or User Specific configurations assigned to you; the Business Configuration does not appear here
- Use the Workshops selector to filter data to specific workshops
- Select Load All Workshops to show all workshops' data, or Load My Workshop to filter to your workshop
- Use the checkboxes to toggle individual panels, reports, and navigation items on or off
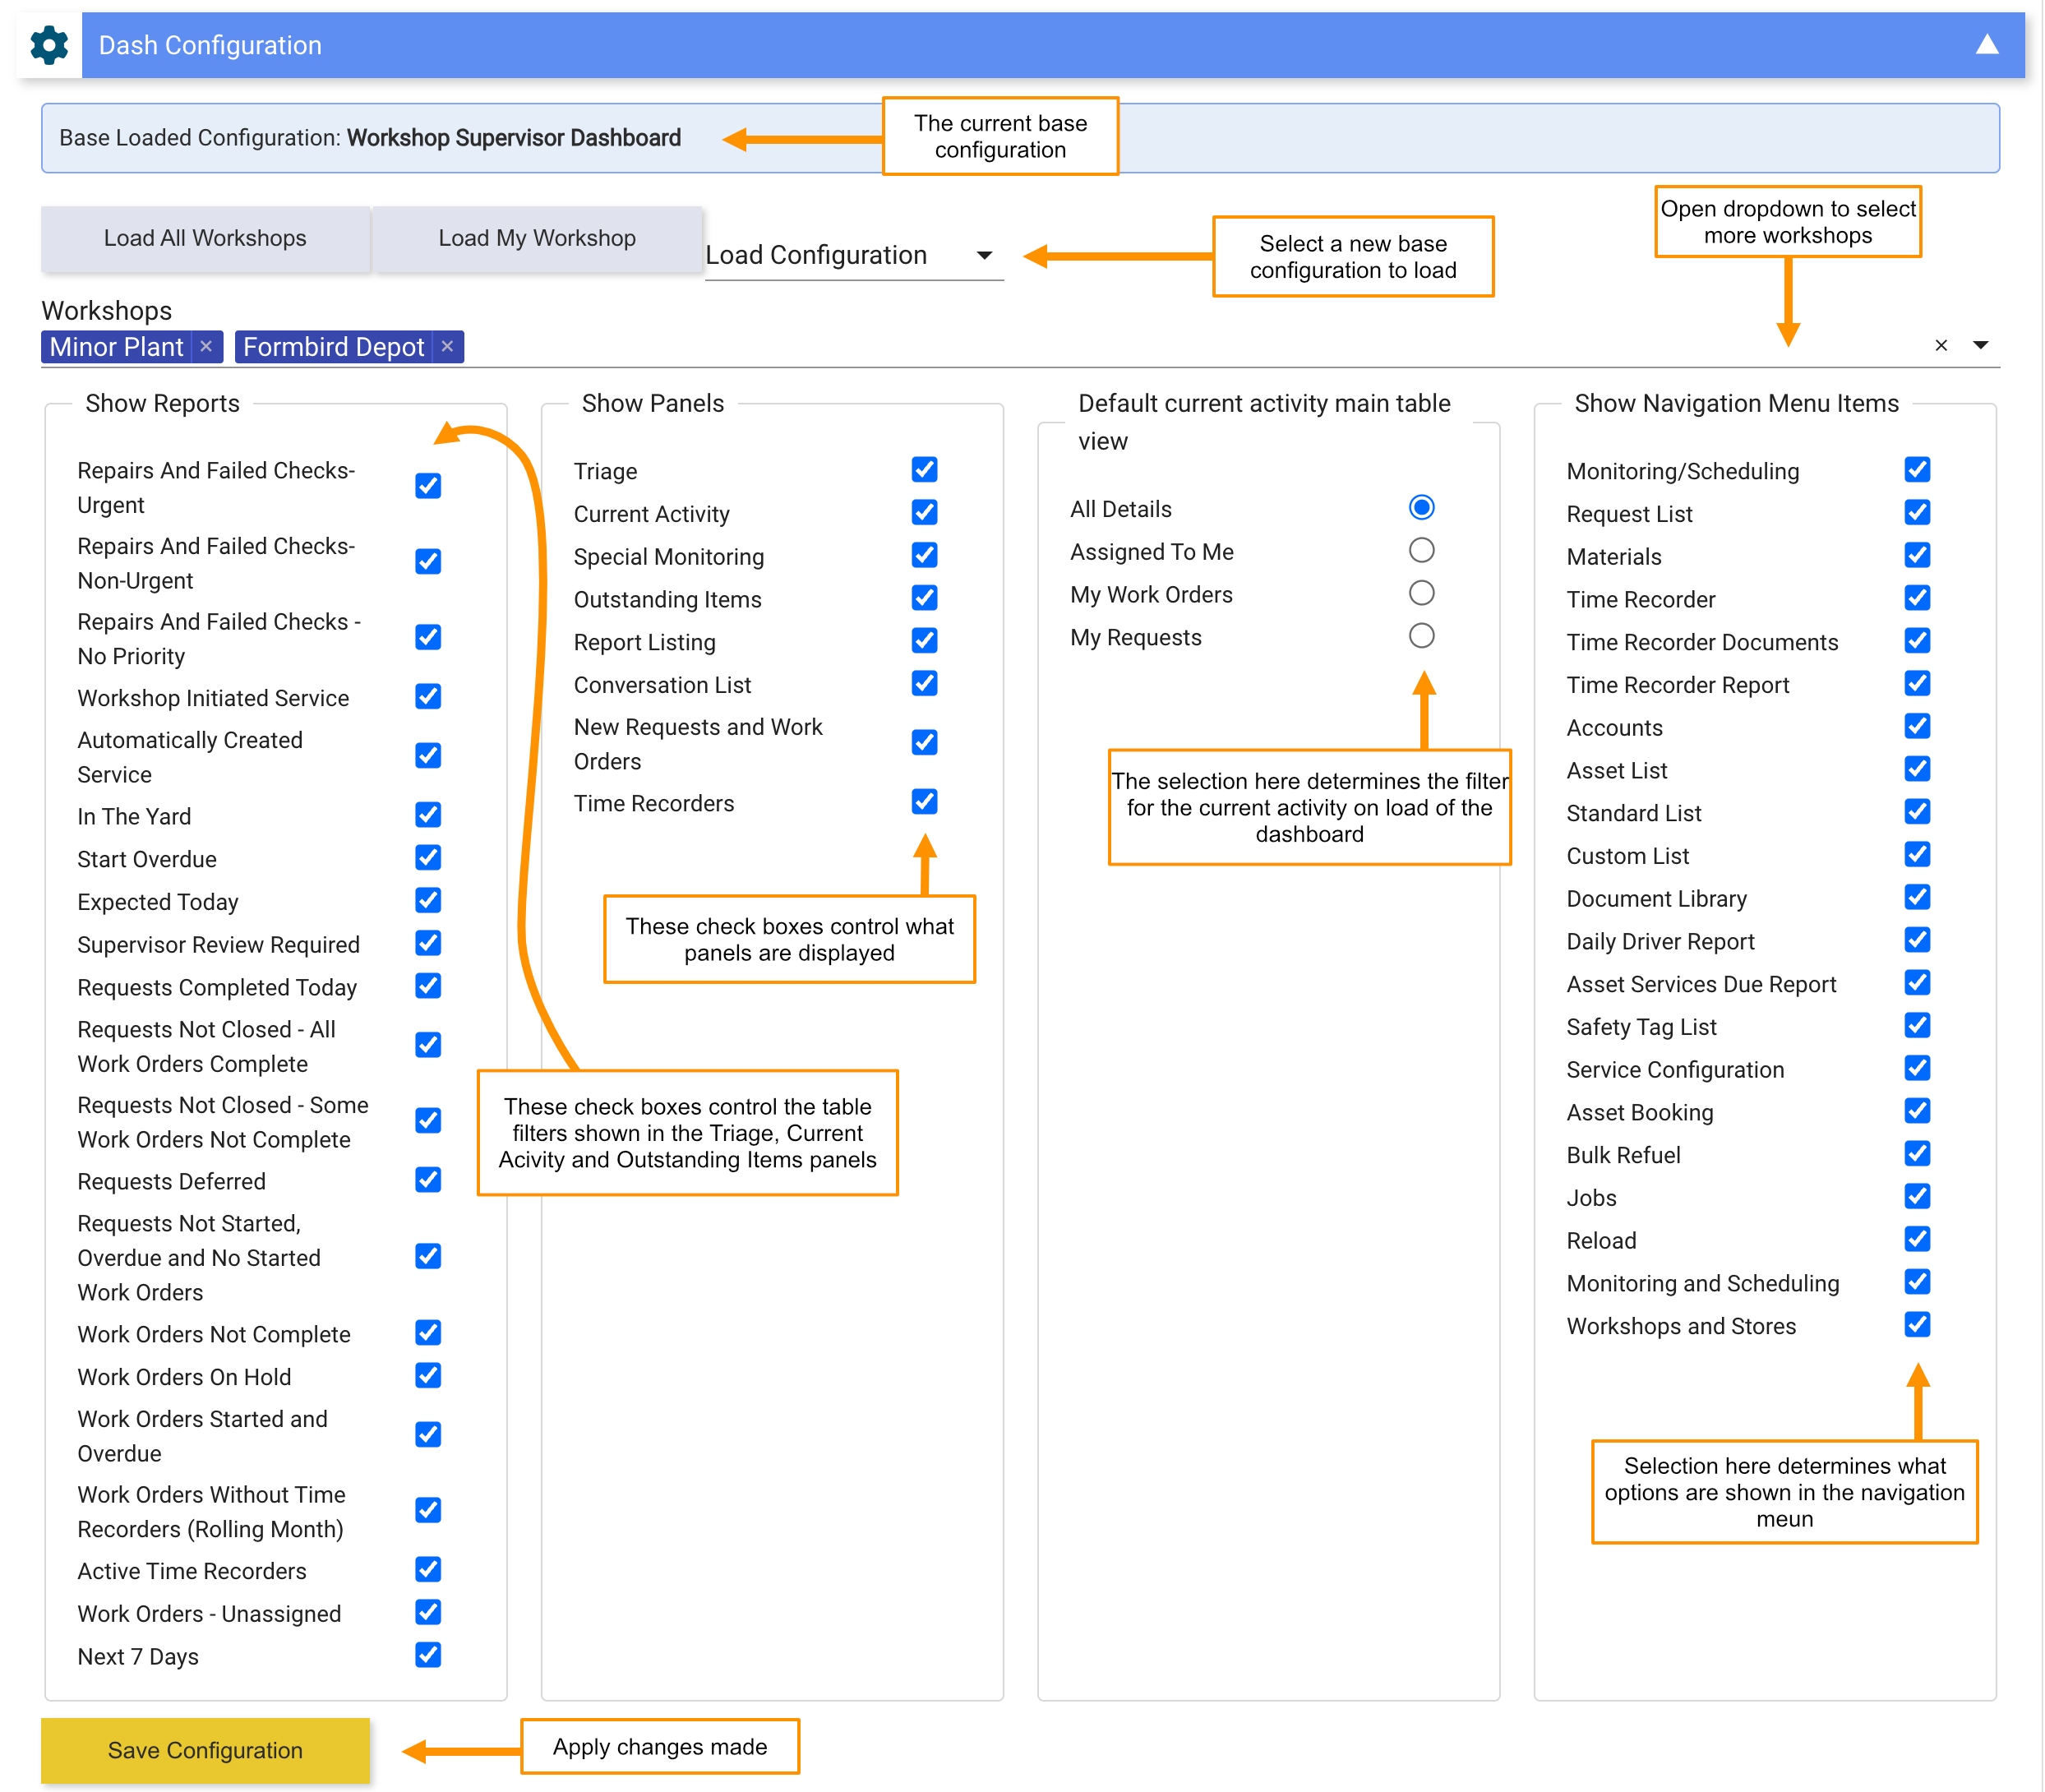
The options shown in the checkboxes are determined by the base configuration assigned to you. An administrator controls which items are available to toggle. Options the administrator has not enabled will not appear here.
Select Save Configuration to apply your current selections. This saves whatever you have set, whether that is a layout chosen from the Load Configuration dropdown, or adjustments you have made to the panel checkboxes and other settings. Changes are saved to your User Preference and only affect your own dashboard. Adjusting settings after selecting a configuration from the dropdown does not modify that configuration. It only changes what is loaded on your dash.
Settings not available in this panel
The following settings are only available in the full Workshop Dash Configuration document and cannot be changed from the dashboard:
- Triage conditions — which criteria must be met before an item is removed from Triage
- Show Create Buttons For — which templates appear as buttons in the New Requests and Work Orders panel
- Default workshops — the workshops loaded when the configuration is first applied
- Default request status — which request status filter is active on load
- Default work order status — which work order status filter is active on load
- Only show my time recorder entries — whether the Time Recorders panel is restricted to your own entries
- How far back closed requests are shown — the number of days before now that closed requests remain visible
- How far back completed work orders are shown — the number of days before now that completed work orders remain visible
- How far back time recorder entries are shown — the number of days of time recorder history loaded by default. The date range picker on the Time Recorders panel lets you view a different range temporarily, but the saved default is set in the configuration document
Administrators can create and manage dashboard configurations for different roles and individuals. See Workshop Dashboard Configuration.
Updated: June 2026 · Formbird FLEET 4.2.8